Hyper-V's virtual TPM backend, TpmEngUM.dll, appears inside vmsp.exe, but that process runs in Isolated User Mode (IUM). Giving an ordinary debugger administrator rights does not resolve the underlying boundary. Virtual Trust Levels (VTLs) come before process permissions and debugger interfaces in this analysis.
A nested-virtualization trace provides a useful path through the problem: observe Hyper-V from the outer VMware instance, sample guest state at a VTL return, then correlate a stack return address with instruction bytes in Secure Kernel. Complete Windows and VMware versions were not retained, so internal offsets are sample-specific. Local checks cover address arithmetic and instruction decoding only; no nested VM was run and no kernel was modified.
VTL and ring are independent coordinates
| Execution level | VTL0 | VTL1 |
|---|---|---|
| ring 3 | Ordinary applications and management processes | IUM trustlets |
| ring 0 | Normal Windows kernel | Secure Kernel |
| Isolation foundation | Hyper-V and second-level address translation | Hyper-V and second-level address translation |
Ring 0 in VTL0 does not gain access to VTL1 user pages merely by being kernel code. Microsoft places IUM and Secure Kernel in VTL1 and documents restrictions on ordinary attachment, thread injection, and memory operations. These are not simply ordinary token-access failures. Microsoft IUM documentation
flowchart TD
  accTitle: Outer debugger and nested virtual TPM
  accDescr: The L0 debugger connects to VMware to observe L1 Hyper-V. L2 Windows uses the virtual TPM backend in L1 VTL1 vmsp.
  subgraph L0["L0: outer host"]
    D["IDA / GDB client"] --> W["VMware Workstation / GDB stub"]
  end
  subgraph L1["L1: Windows with Hyper-V"]
    H["Hyper-V"]
    K["VTL1: Secure Kernel"]
    P["VTL1 ring 3: vmsp.exe / TpmEngUM.dll"]
    H --> K
    K --> P
    subgraph L2["L2: Windows guest"]
      T["Virtual TPM consumer"]
    end
    T --> P
  end
  W -. "Outer debugging view" .-> H
The starting capability is control of the outer virtual-machine monitor's debugger. That is not equivalent to crossing the boundary from an ordinary VTL0 process on a physical machine. The L2 TPM consumer and the L1 backend must also remain separate objects in the environment map.
Choose the event before interpreting registers
HvCallVtlReturn has call code 0x0012 and switches to the next lower VTL enabled on the virtual processor. Microsoft hypercall definition
The identified internal Hyper-V handler appears at 0xfffff8000022c760, and the analysis record describes a table with 0xee entries. Those are image-specific findings, not fixed addresses or a public ABI guarantee about internal table length. The event gives the sample a meaningful context, but current hypervisor registers must still be distinguished from saved VTL1 guest registers.
When the GDB backend supplies no memory map, IDA's manual memory regions tell the debugger which ranges to attempt to display. The corresponding interface is illustrated below:
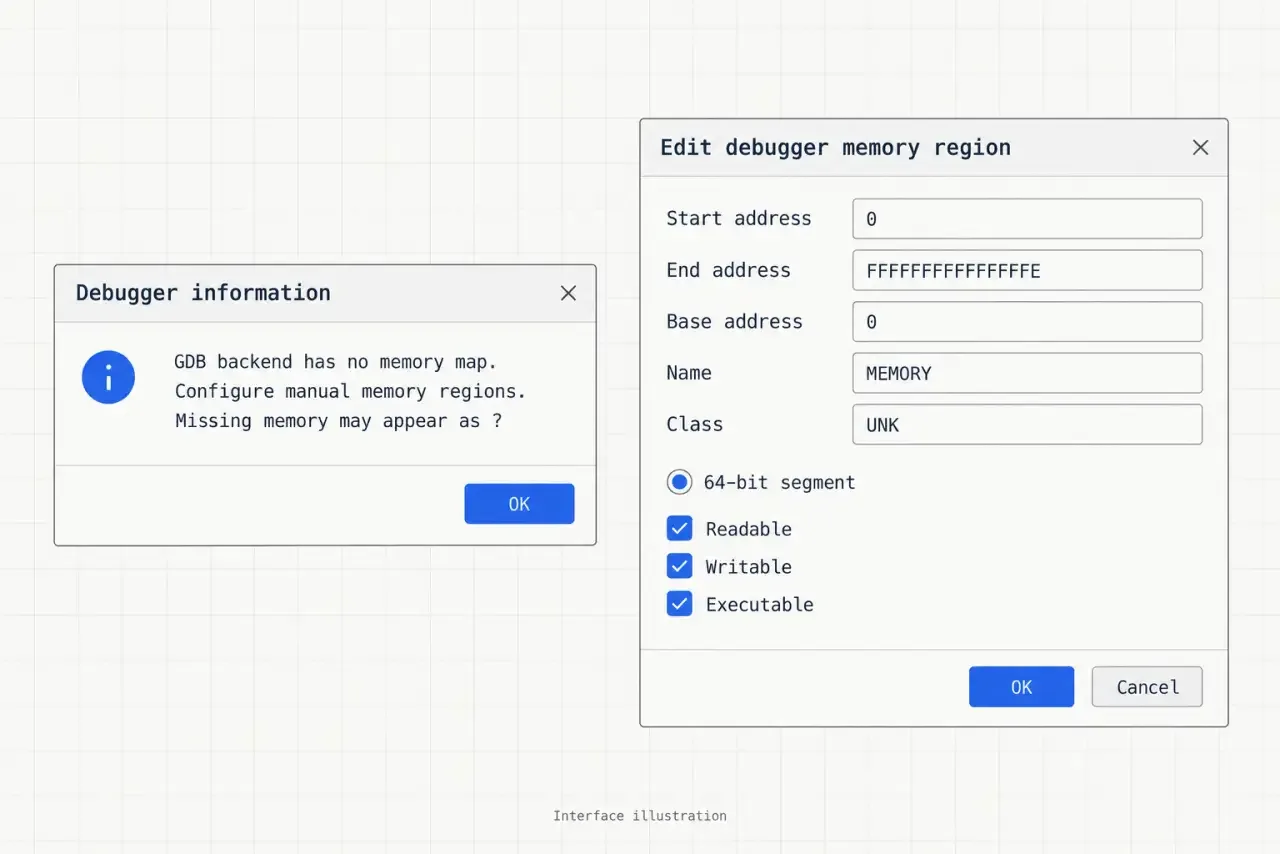
The broad range from 0 to 0xFFFFFFFFFFFFFFFE describes display-side read attempts only. The Readable / Writable / Executable settings neither establish actual page permissions nor change VTL or EPT permissions. A precise range is preferable to treating the entire address space as accessible. Current documentation explains the interface, not the historical IDA version.
Confirm image identity before rebasing. A candidate PE found by searching backward from an IDT entry or current instruction might belong to the normal kernel, Secure Kernel, or Hyper-V. Check image size, sections, machine type, and the corresponding file before adding an RVA to the correct module's runtime base.
Trace pointer slots backward from VMPTRLD
The saved guest RIP may lie in a separate trampoline rather than in the Secure Kernel image. The record shows indirect call paths through both ShvlpVtlReturn and HvcallCodeVa. Their shared clue is a preceding call rax, which may leave a return address into the image on the guest stack.
Before locating that stack, trace the input to VMPTRLD. These selected sample instructions omit unrelated intervening operations; rdx points to the VP on this path:
movzx   eax, r8b
mov     rbx, [rdx+rax*8+2A8h]
mov     rcx, [rbx+0E90h]
vmptrld qword ptr [rcx+188h]
For VTL index 1, the pointer slot is 0x2a8 + 8 = 0x2b0. Interpreting entry RCX as the VP comes from this internal handler path; it is not a rule for every public hypercall calling convention.
vp       = observed VP pointer
vtl1     = read_u64_virtual(vp + 0x2b0)
state    = read_u64_virtual(vtl1 + 0xe90)
vmcs_pa  = read_u64_virtual(state + 0x188)
Each stage dereferences a pointer. Adding all three offsets does not reproduce the chain. A separate layout diagram places the VP's VTL slots at 0x180 / 0x188, but describes another layout; the current instructions establish 0x2a8 / 0x2b0 here.
The same disassembly contains an enlightenment-feature branch, with VMPTRLD anchoring one path. Nearby references to VMCS do not establish that the other branch uses the same in-memory representation.
Raw VMCS offsets are not field encodings
The State object's eight-byte value is:
vmcs_pa0x00–0x07
Little-endian decoding gives 0x109144000. The debugging monitor's phys command switches to its physical-address view, where the record observes:
| State | Raw region offset | Observed value | VMREAD field encoding |
|---|---|---|---|
| guest CR3 | 0x8b0 |
0x04c00002 |
0x6802 |
| guest RSP | 0x918 |
0xfffff80758344ec8 |
0x681c |
| guest RIP | 0x920 |
0xfffff80758310035 |
0x681e |
Field encodings are operands to VMREAD / VMWRITE, not offsets to add to a VMCS base. Microsoft's enlightened VMCS documentation provides an architectural encoding cross-reference, but that public structure is not the raw region observed here.
0x8b0 / 0x918 / 0x920 are not a structure ABI portable across Windows, CPU, and VMware versions. Physical mode also does not resolve nested translation automatically. Every address needs a label identifying its guest-physical layer and any remaining EPT/NPT translation.
Two translations connect the stack to the call site
The first recorded mapping starts this chain:
CR3                  0x0000000004c00002
page-table root      0x0000000004c00000
guest RSP            0xfffff80758344ec8
RSP physical view    0x0000000003e24ec8
stack value          0xfffff8075f460217
return physical view 0x0000000003e9a217
The value at the translated RSP is not another physical address. It is a return virtual address requiring a second translation:
return_va0x3E24EC8–0x3E24ECF
The second translation yields 0x3e9a217. The preceding two bytes, at 0x3e9a215, are FF D0 and decode as call rax:
The return location, call length, and actual bytes corroborate one another. That is stronger evidence than a kernel-looking value on the stack. Complete page-table entries were not retained, however, so the physical mappings remain recorded results rather than a page-table walk independently repeated locally.
Four-level, 48-bit canonical-address splitting can be checked independently:
def indices4(va):
    return tuple((va >> s) & 0x1ff for s in (39, 30, 21, 12))

rsp = 0xfffff80758344ec8
ret = 0xfffff8075f460217
assert indices4(rsp) == (496, 29, 193, 324)
assert indices4(ret) == (496, 29, 250, 96)
assert (rsp & 0xfff) == (0x3e24ec8 & 0xfff) == 0xec8
assert (ret & 0xfff) == (0x3e9a217 & 0xfff) == 0x217
assert (0x04c00002 & 0x000ffffffffff000) == 0x04c00000
assert int.from_bytes(bytes.fromhex("17 02 46 5f 07 f8 ff ff"),
                      "little") == ret
An extended test checked index round trips for 4096 canonical addresses and rejected 4 out-of-range or noncanonical inputs. It also checked two little-endian values, page offsets, and three VMCS locations. A real walk must interpret CR3 using state such as CR4.LA57, physical-address width, and CR4.PCIDE, check present bits, and handle 1 GiB / 2 MiB leaves. This model does not claim to perform those runtime checks.
Verify image identity and the debugging decision separately
Searching backward through physical pages from a return pointer depends on incidental layout. A more robust analysis walks backward through the image's virtual pages, translates each page, then checks MZ, e_lfanew, PE\0\0, machine type, image size, and section boundaries. Virtual contiguity does not imply physical contiguity, and MZ alone does not identify Secure Kernel. Microsoft PE format
The sample then changes the Boolean result on one epilogue path of SkpsIsProcessDebuggingEnabled. The two encodings are compared here without treating an address from another environment as reusable:
| State | Instruction | Encoding | Length |
|---|---|---|---|
| Recorded original | mov al, bl |
8A C3 |
2 |
| Recorded adjustment | mov al, 1 |
B0 01 |
2 |
Local objdump decoding independently confirmed both encodings and FF D0; no adjustment was written to a running system. Equal length establishes only local instruction-size compatibility. It says nothing about other return paths, caller expectations, integrity mechanisms, or concurrent execution. Changing this Boolean decision is also not equivalent to disabling all IUM isolation.
What successful attachment establishes
The relevant process and module hierarchy is:
- vmcompute.exe
- vmwp.exe
- vmsp.exe
- TpmEngUM.dll
- iumbase.dll
- iumdll.dll
- vmsp.exe
- vmwp.exe
The WinDbg 1.2210.3001.0 attachment record includes TpmEngUM.dll loading and the initial breakpoint. Two decisive output items are retained:
ModLoad: 00007ffc`423a0000 00007ffc`43292000 C:\Windows\System32\TpmEngUM.dll
ntdll!DbgBreakPoint:
00007ffc`50270bb0 cc int 3
This supports debugger reachability in that environment, not the existence of a TPM vulnerability. It also does not establish that every readable address belongs to VTL1. Breakpoint hits, registers, memory views, and code paths must identify the object actually being observed.
Keep the review sequence narrow: establish image identity, choose a meaningful event, recover the right guest context through dataflow, then close the chain with a return address and code bytes. If versions, offsets, or address views disagree, return to the earliest mismatch instead of continuing toward a kernel modification.